 
| ||
|
|
|

UNDERSTANDING RISK by Bill Channels
My background in blackjack began in Atlantic City in 1978 where I learned, by attending a four-session school, how to count cards. That led to considerable involvement with Blackjack teams and travel many places to take the casinos' money. After the liberal rules in Atlantic City were dumped by the casinos, my blackjack-playing days went dormant for some time. I'd do the occasional trip to Reno or Las Vegas, but it wasn't until casino gaming came to Missouri in 1994 that I got back into blackjack with both feet. Now I live close to four casinos, can play as much as I want and can tell you - with first-hand experience - how to win at blackjack. My Website is
www.gamemasteronline.comNote: By permission from the author, this is an excerpt on "Understanding Risk" from Channel’s excellent new book, The (Darn Near) Complete Book of Winning at Blackjack.
Part F. Understanding Risk
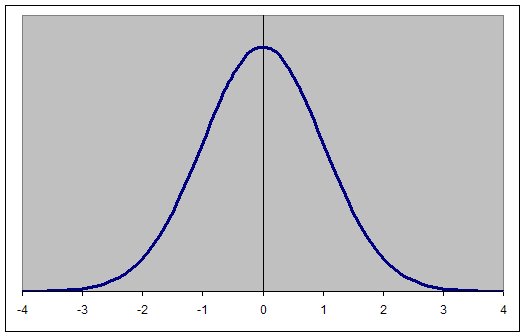
If you flip a coin 100 times, your expectation is to receive 50 heads and 50 tails. But the actual results may well be different and the measurement of how far the results are from expectation is called variance, which is converted to standard deviation (sd). Standard deviation is a mathematical term used to predict all of the possible outcomes of a situation, usually expressed as a range of results from high to low or vice-versa. In our coin-flipping exercise, we expect 50 heads and 50 tails to occur, but roughly two-thirds of the time the actual result will be somewhere between 45 and 55 either way. That is, a result of 55 heads and 45 tails or 55 tails and 45 heads or something in between is not unusual; it will happen 68.3% of the time. The 68.3% figure is a mathematical constant that represents one standard deviation from the expectation. If we were to run dozens of "trials" or samples of 100 flips (that is, record 100 flips then stop and do another 100), we could plot our results on a chart where the middle number is 50-50 but the vast majority of results would fall between 55 and 45 either way. However, some results would be outside that range which would create what’s known as a "bell curve" because it takes on the shape of a bell; high in the middle and then tapering off to the left and right like you see here:
| Heads | Tails |
|
|
This chart is expressed in terms of standard deviations that range from 0 to 4, with 0 representing no deviation from expectation (or an exact result of 50-50 in a coin-flipping contest), with 4 being a result roughly equal to 70-30. Notice that the numbers to the left are minus and the ones to the right are plus. That’s because we can experience a "minus 1" standard deviation or a "plus 1" standard deviation but not both at the same time. I labeled one side Heads and the other side Tails in order to represent the fact that we might see a shortage of one, which would cause an "excess" of the other. If we were to experience a 100-flip trial where Heads came up only 30 times and Tails came up 70 times, it would be a 4-SD event on the right side; in other words a "win" by Tails that is far in excess of what we would normally expect. We can also do this by substituting "win" $$$ for "win" Tails, as you’ll see below.
Important! One standard deviation covers what will happen 68.3% of the time; two standard deviations cover what will happen 95% of the time and three standard deviations cover what will happen 99.7% of the time, which shows you how rare a four standard deviations result is.
Nothing has caused counters to give up Blackjack more than a lack of understanding about normal, everyday variance; what most people call "luck." By the way, standard deviation is the square root of variance, but don't sweat the technical stuff; all you need to know is in the chart below, which is expressed in terms of dollars. It’s easy for counters who have trained hard to (unrealistically) expect to win each time they play, so when they have several losing sessions they might forget what they've learned. The next thing you know, they're over-betting their bankroll, fail to play their hands properly - like not doubling when they should - and when they wake up from the daze, their money is gone.
PATIENCE AND SKILL WIN. HUNCHES AND WISHING WILL NOT WIN. PRAYER DOES NOT WORK AT BLACKJACK.
So, what can you expect? What's the worst that can happen? Well, you can lose all your $$$, but if you establish a bankroll of at least 50 "top" bets, play proper basic strategy at all times and don't over-bet, you stand a good chance of making a profit at Blackjack assuming the game at your local casino is one that can be beaten. (Hey, if it were easy everybody would be doing it.) The table below illustrates the possible results from varying hours of play at a fairly typical game. Shown with the expectation are the possible dollar results as measured by one standard deviation (68.3% of the time) and two standard deviations, which cover what will happen 95% of the time. Three standard deviations cover what will happen 99.7% of the time but I do not show that here.
|
Expected Win / Standard Deviation Assumptions: $9 average bet, 50 hands per hour, 1.20% average advantage. |
|||
|
Results |
|||
|
Time |
Expected Win |
68.3% of the time |
95% of the |
|
3 hours |
$16.00 |
+$142 to -$109 |
+$267 to -$235 |
|
12 hours |
$64.00 |
+$316 to -$186 |
+$567 to -$438 |
|
48 hours |
$260.00 |
+$260 to -$243 |
+$1264 to -$746 |
|
90 hours |
$486.00 |
+$1,175 to -$202 |
+$1863 to -$890 |
Let's talk about this a bit. If you were to play several hundred "sessions" of 3 hours each (about 150 hands in each session), the average win for each of those would be $16. This comes from using the $5 to $60 betting spread that we discussed above (which results in a $9 average bet per hand). But very few sessions would end with a win of exactly $16.00; about two-thirds would have a result of somewhere between a win of $142 and a loss of $109, which is one standard deviation to the plus side and one to the minus side. Most of the other sessions could see you winning as much as $267 or losing as much as $235 (2 SD) and a few would see wins or losses even bigger than that! Now do you see why it takes a bankroll of $3000 to support a $5 to $60 betting spread? In order to be successful, you must be able to absorb losses which are many times that of your "expectation." These fluctuations are real; they will happen to you at one time or another and if you're not prepared for them, you'll either get frustrated and quit or lose your cool and blow your bankroll. Now look at the results for 90 hours of play. Most of you will be - at worst - about break-even after that many hours. A few might be up by $1863 (2 SD to the plus side), but some of you could be down by $890 or more, which is 2 SD to the minus side. Boy, I'd hate to hear the names you'll be calling the old GameMaster then! But it can happen and it won't be unusual if it does, so ask yourself right now if you can deal with playing a disciplined game for 90 hours, still be at a loss and continue playing and betting as I've shown you. It's sad, but most of you won't be able to cope with that and you'll be another victim of standard deviation. That's why I'm not afraid of the casinos going out of business, even if every player in the world learns how to count cards; few have the patience to stick it out. I don't want to be overly negative, but that's the reality. However, if you do stick it out, the percentages will eventually begin working in your favor. As I tell all my students, the money comes in "chunks" at Blackjack. This is not a slow, consistent way to make money; your bankroll will, at times, resemble a roller coaster and it's difficult to deal with that from an emotional point of view. Each of us is different in that regard, of course but I’m one of those who believes taking a risk may cause you to lose but refusing to take any risk virtually guarantees you’ll lose.
Note: You can order a copy of Channel’s book at a discount by clicking here.
|
|
©2015, DeepNet Technologies. No material to be copied without express permission of DeepNet Technologies.
This site developed by
DeepNet Technologies, Ontario, Canada. Contact webmaster @ bjinsider . com
if you have problems.
This site is best viewed in a 800x600 graphics mode, or higher.